CANDLESTICK STRATEGY FROME FX ACCURATE
About CANDLESTICK STRATEGY FROME FX ACCURATE
A candlestick chart is simply a chart made of individual candles, which traders use to understand price action. Candlestick price action involves pinpointing where the price opened for a period, where the price is closed for a period, as well as the price for a specific period when the price is high and lows.
Price action can signal trends and vicissitudes to traders in all financial markets. For example, clusters of candlesticks may form patterns occurring throughout the forex chart that may indicate reversal or continuation of the trend. Candlesticks can also create individual forms that may indicate buying or selling entries in the market.
The duration for each candle to be displayed depends on the time frame chosen by the trader. A popular timeframe is a daily timeframe, so the candle will indicate open, closed and high and low for the day. Various components of a candle can help you predict where the price may go, for example, if a candle closes far below its open, it may indicate a further price drop.
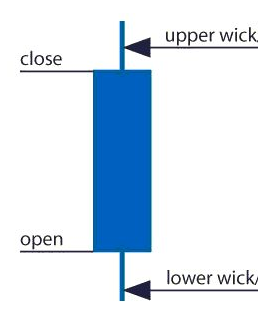
Three specific points (open, close, wicks) are used in the manufacture of a value candle. The first points to consider are the open and close values of the candles. These points identify where the price of an asset begins and ends for a selected period and will form the body of a candle. Each candle depicts the price movement for a certain period of time that you choose when looking at the chart. If you are viewing a daily chart, each individual candle will display the open, closed, upper and lower wick of that day..
ENGULFING
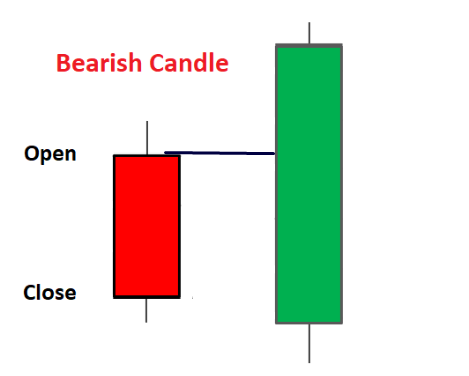
The sharply enclosed candle is one of the most obvious price action signals of the candle forex market. Many traders will use this candlestick pattern to identify price reversion and continuities to support their trading strategies. bullish engulfing pattern appearing at the bottom of a downtrend
Current candle above the high of the previous candle is required
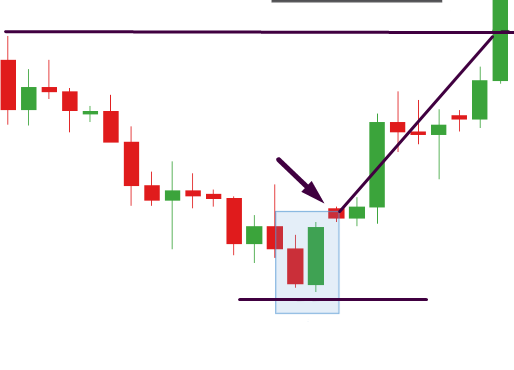
reversals using points
1. long positions – last bearish candle The candle after that should be up
2. short positions – last bullish candle The candle after that should be down
stop-loss/take-profit
long positions- stop-loss =last low,take-profit=swing high
short positions-stop-loss=swing high,take-profit=last low
Pin Bar Trading Strategy
Pin Bar Trading Strategy
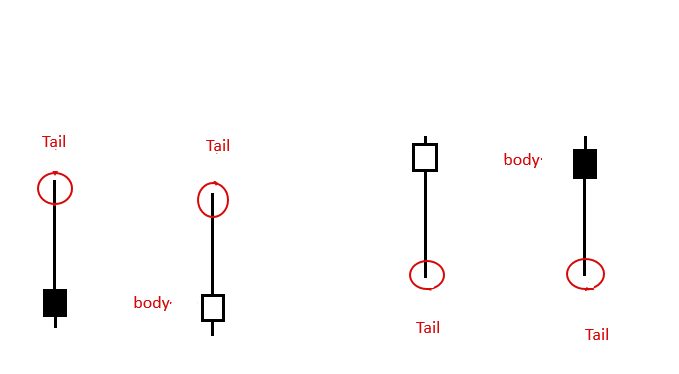
A pin bar pattern consists of a price bar, usually a candlestick price bar, which represents a sharp reversal and denial of value. Reversing the pin bar as it is sometimes called is defined by a long tail, “wick”. The area between the opening and closing of the pin bar is called the “real body”, and the pin bar usually has smaller actual bodies than the short tails.
The tail of the pin bar denotes the area of the price that was rejected, and the implication is that the price will continue to move opposite the direction of the tail points. Thus, a bearish pin bar signal is one that has a long upper tail, showing a rejection of higher prices with the indication that the price will fall in the near-term. A rapid pin bar signal has a long lower tail, showing a rejection of lower prices with the indication that the price will increase in the near-term.
How to Trade with Pin Bars
The first, and perhaps most popular, “in the market” pin is entering the bar trade. This simply means that you enter the trade at the current market price.
Note: Based on this, the pin bar pattern must be closed before entering the market. Unless the bar is closed as a pin bar pattern, it is not actually a pin bar.
Another entry option for the PIN bar trading signal is entering the PIN bar at 50% return. In other words, you will wait for the price to return from the high pin to the halfway point of the entire pin bar’s range from high to low, or its “50% level”, where you have already placed a limit entry order.
A trader can also enter a pin bar signal using an “on-stop” entry, which is placed higher or lower than the pin bar.
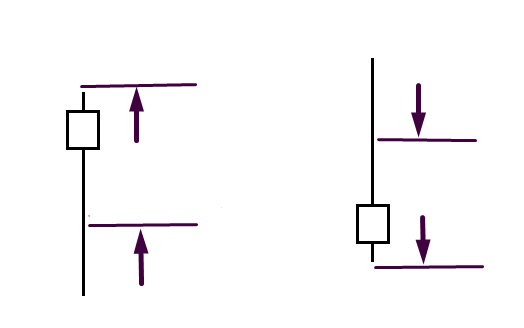
Here is an example of what different pin bar entry options might be like:
Here’s an example of what the various pin bar entry options might look like:
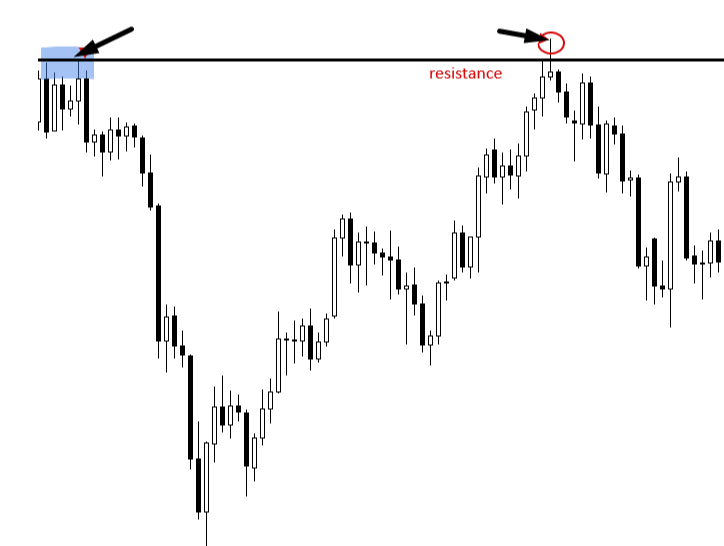
Trading Pin Bars Chart Levels
When trading a pin bar counter to, or against a dominant trend, it’s widely accepted that a trader should do so from a key chart level of support or resistance. The key level adds additional ‘weight’ to the pin bar pattern, just as it does to the counter-trend inside bar patterns. Any time you see a point in the market where price initiated a significant move either up or down, that is a key level to watch for pin bar reversals.
SL below Pin Bars level
tp dubble the sl level
Enter the world’s largest trading market with fxaccurate. Whether you are exclusively trading currency or using your current portfolio as a currency to further diversify, we at fxaccurate will provide you with the most profitable, reliable and reliable Premium Forex Service.